タグ検索:validation

OVERVIEW

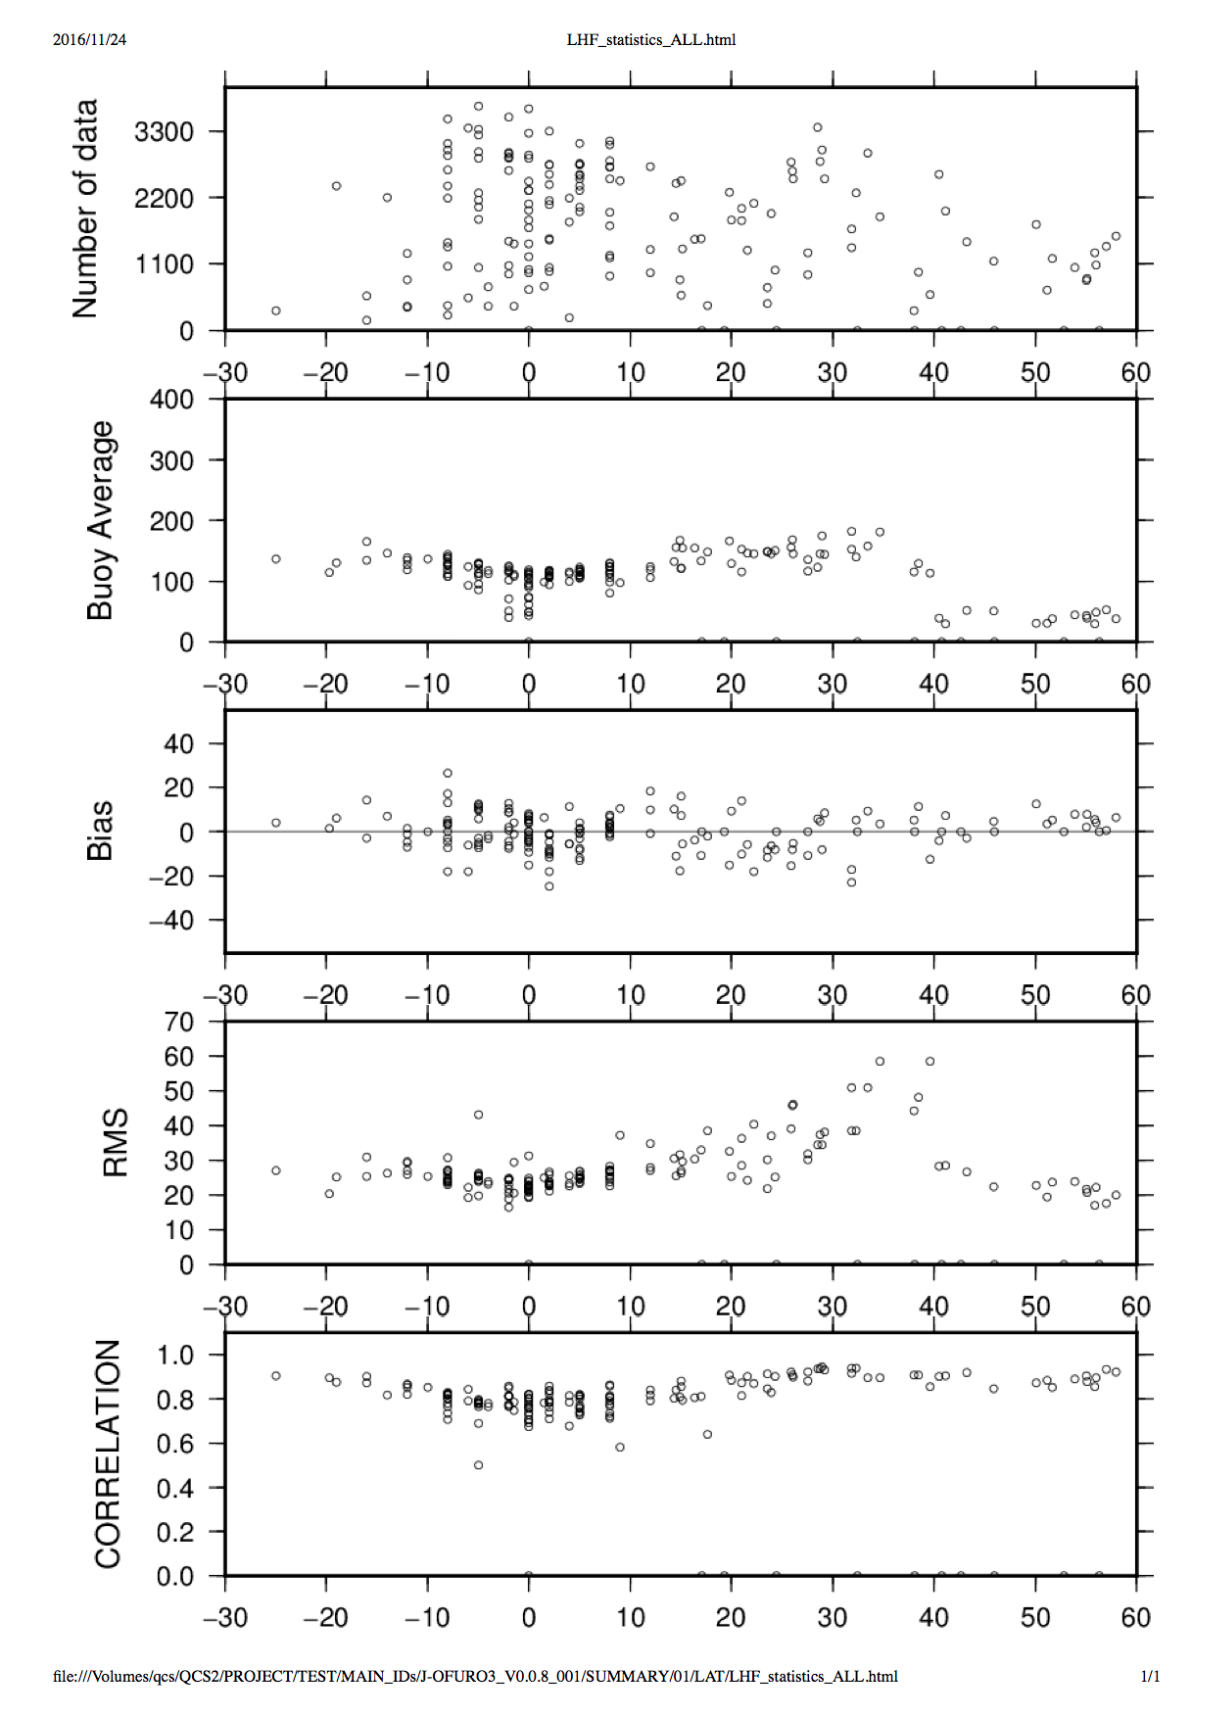
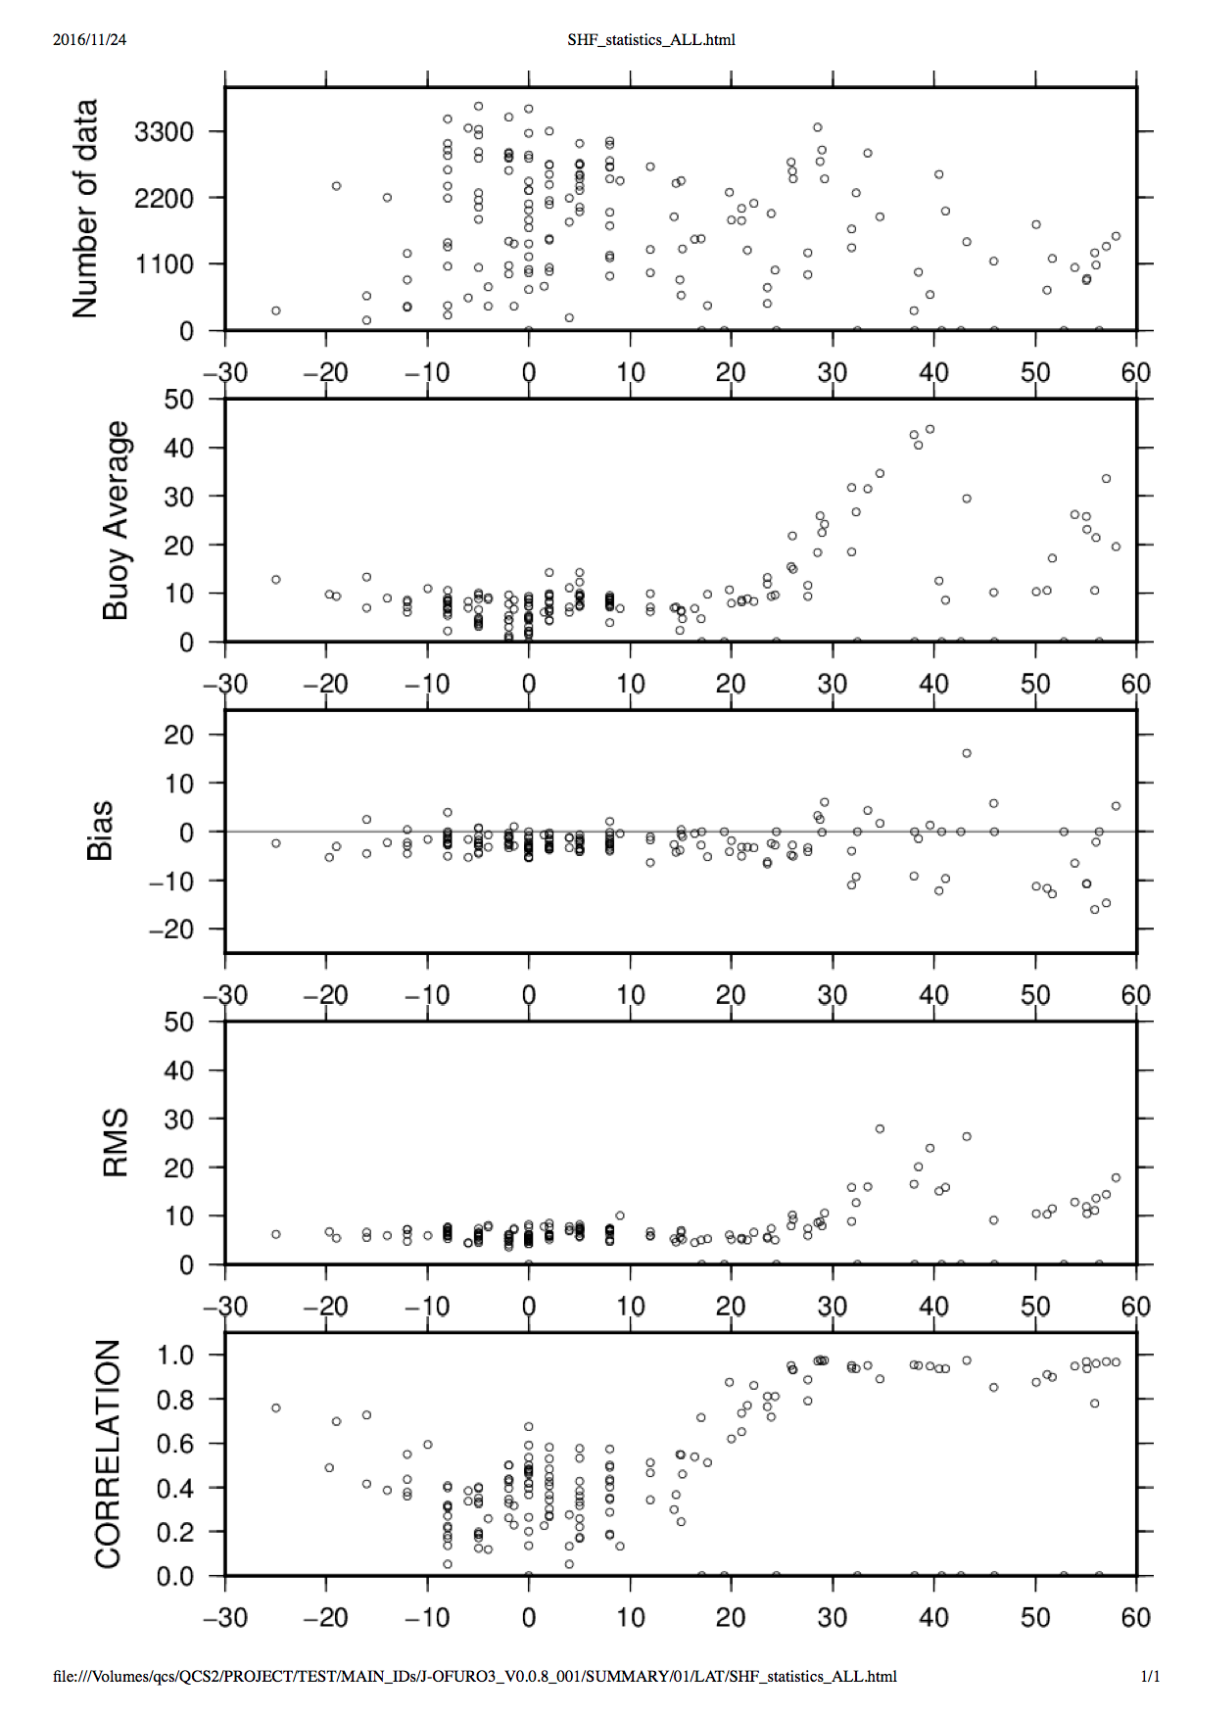
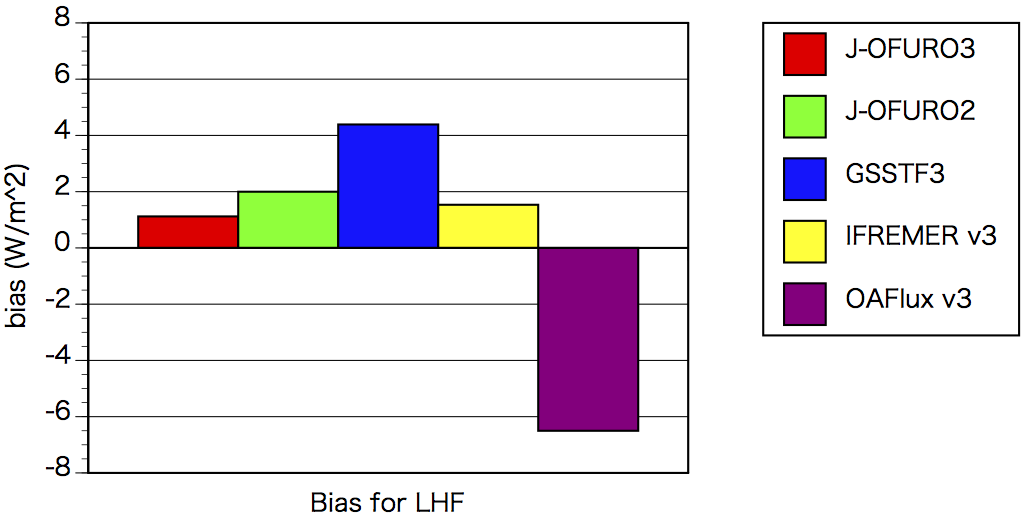
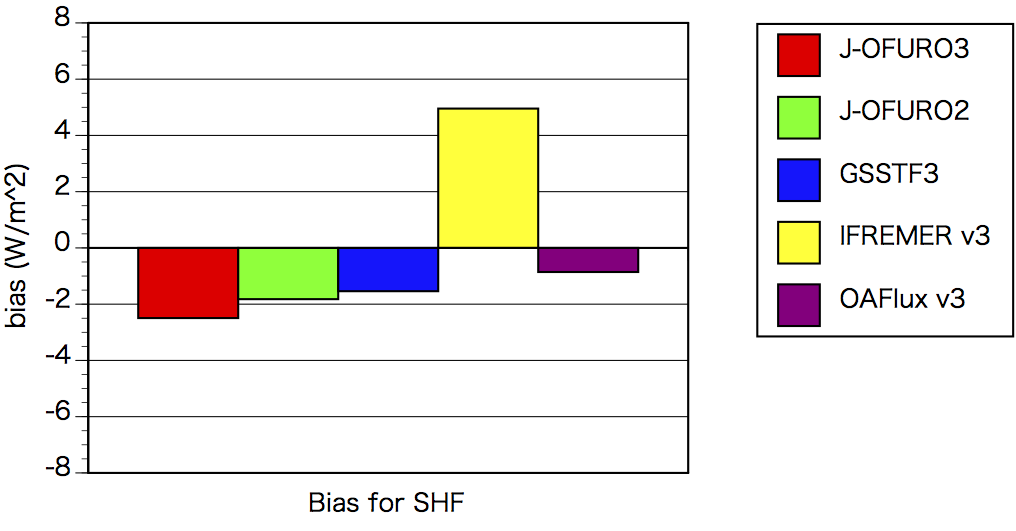
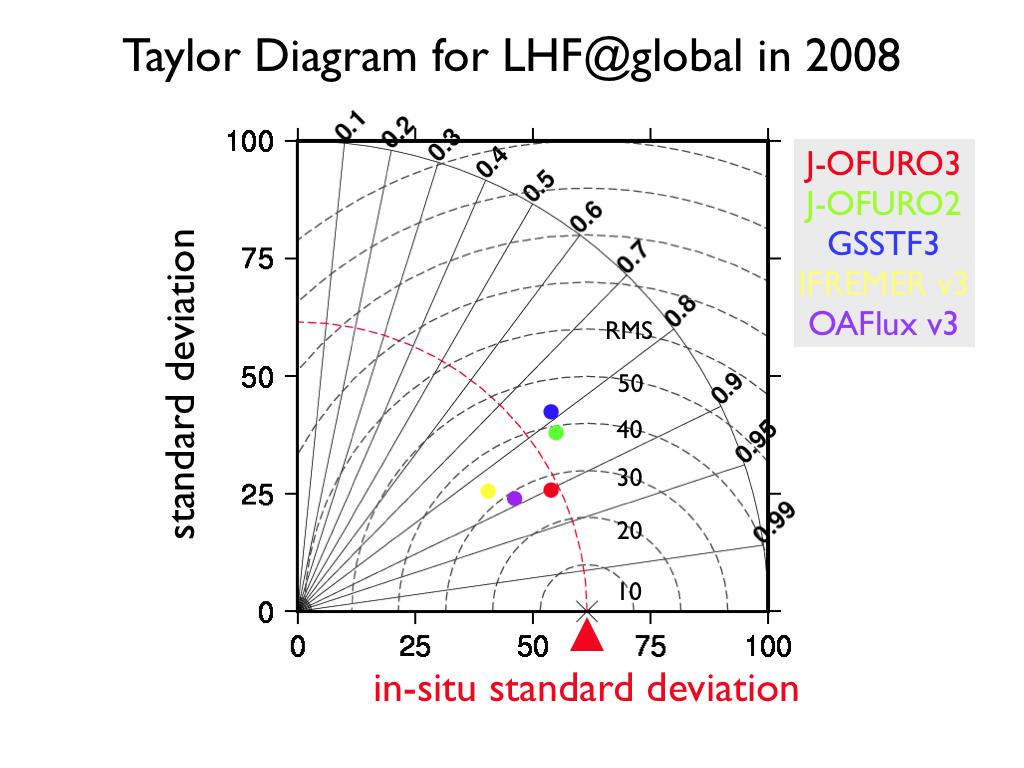
To confirm how much J-OFURO3 has improved compared with the previous version, and to understand the differences from the other global data sets, an inter-comparison among various datasets was conducted by comparing results from Quality Checking System (QCS). The targets are five kinds of global daily data sets including J-OFURO3 V1.0 for the latent heat flux (LHF) and sensible heat flux (SHF). The period of the inter-comparison is a year of 2008. While the QCS contains in situ data for 25644 days from 114 surface moored buoys in this period, the in situ data for only 17064 days, which are commonly available in five kinds of data sets, were used for the inter-comparison. By the inter-comparison of mean fields, the difference among five kinds data sets was relatively small and within +- 7 W/m^2. The largest (negative) bias for LHF was -6.5 W/m^2 in OAFlux. The largest bias for SHF was 5.0 W/m^2 in IFREMER. By the inter-comparison of variability, first, clear is a significant improvement of J-OFURO3 from J-OFURO2. The RMS error is 26.8 W/m^2 improving about 10 W/m^2. Second, the J-OFURO3 shows the most accurate in variability compared with other satellite products. However, significant improvement was not found for SHF. This is because there is no significant change in air temperature estimate in J-OFURO3 from J-OFURO2. The differences in variability of SHF among the data sets were relatively small and 5–9 W/m^2.

INTRODUCTION

This page introduces a summary of an inter-comparison of global data set of satellite-derived turbulent heat fluxes including J-OFURO3 V1.0. You may confirm how much J-OFURO3 has improved compared with the previous version. In addition, you may also understand the differences among satellite-derived products including J-OFURO3.

TARGET DATASETS

The inter-comparison was conducted for a year of 2008 using following five kinds of datasets.
All datasets are gridded daily mean datasets and publicly available on-line.
Spatial gird is regular and the size is 0.25 degree except for OAFlux which provides a 1.0 degree grid data set.
Any pre-processing like converting gird size was not carried out in this inter-comparison.

dataset nametypespatial grid sizeversion
J-OFURO3satellite0.25deg.V1.0
J-OFURO2satellite0.25deg.HF004
GSSTF3satellite0.25deg.v3
IFREMERsatellite0.25deg.v3
OAFluxsatellite+reanalysis1.0deg.v3

RESULTS

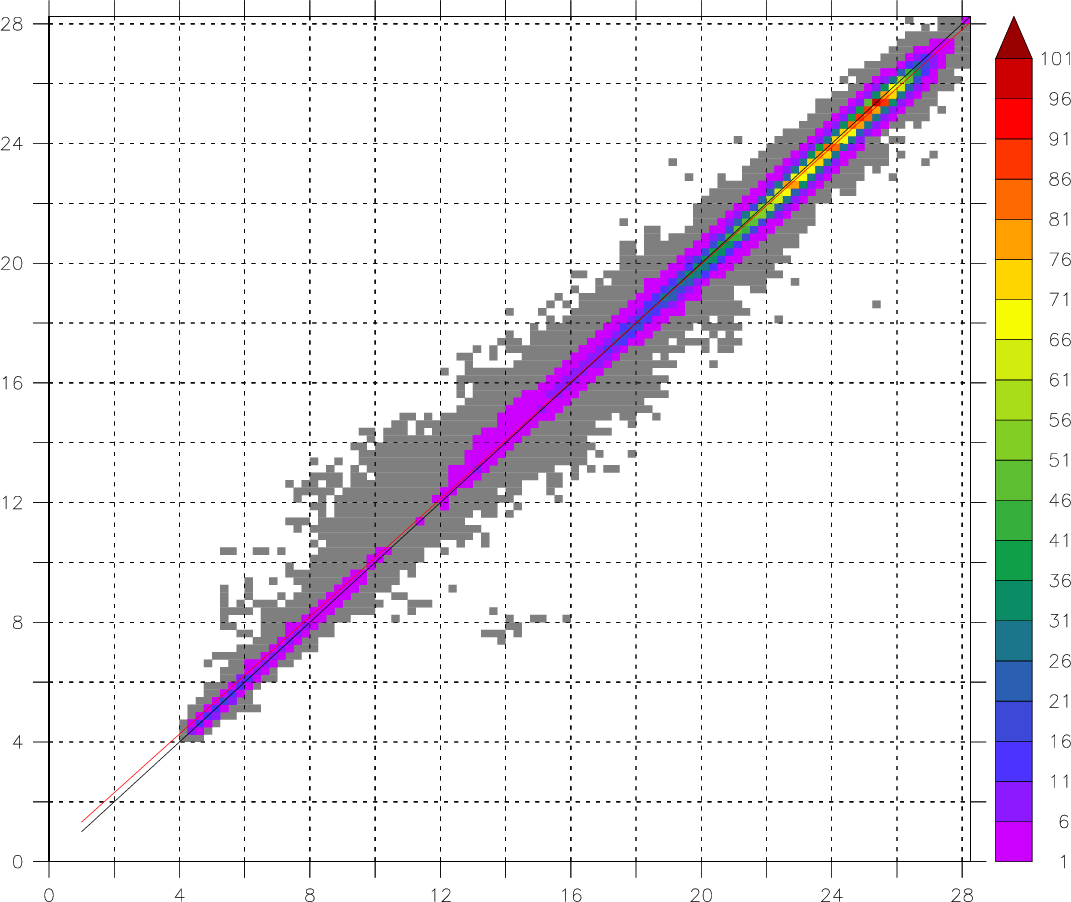
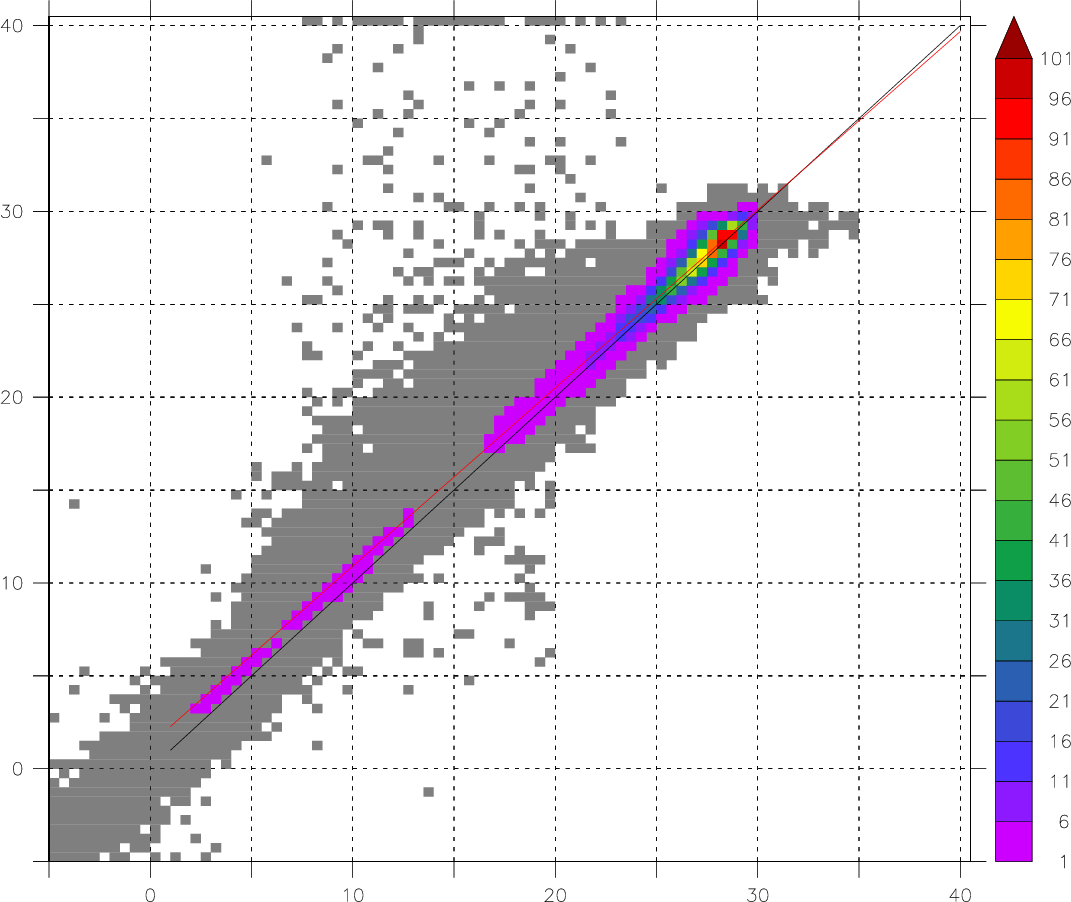
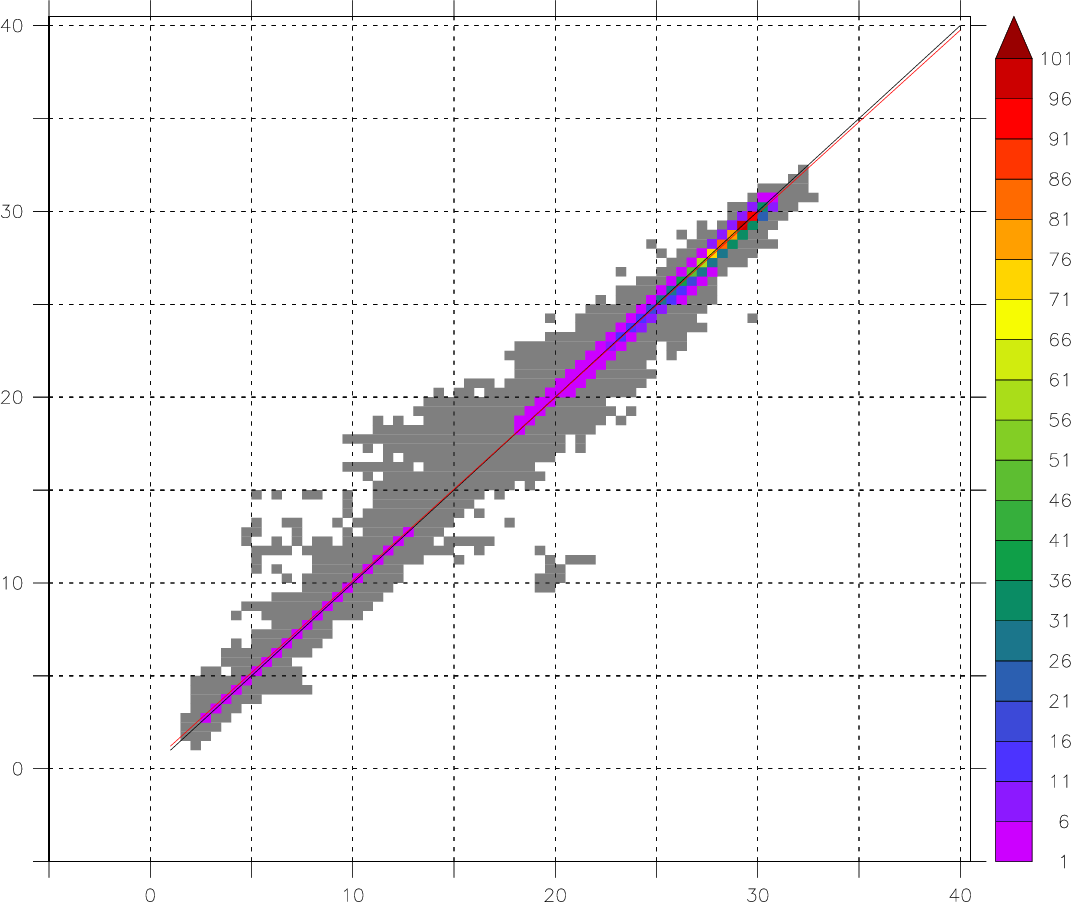
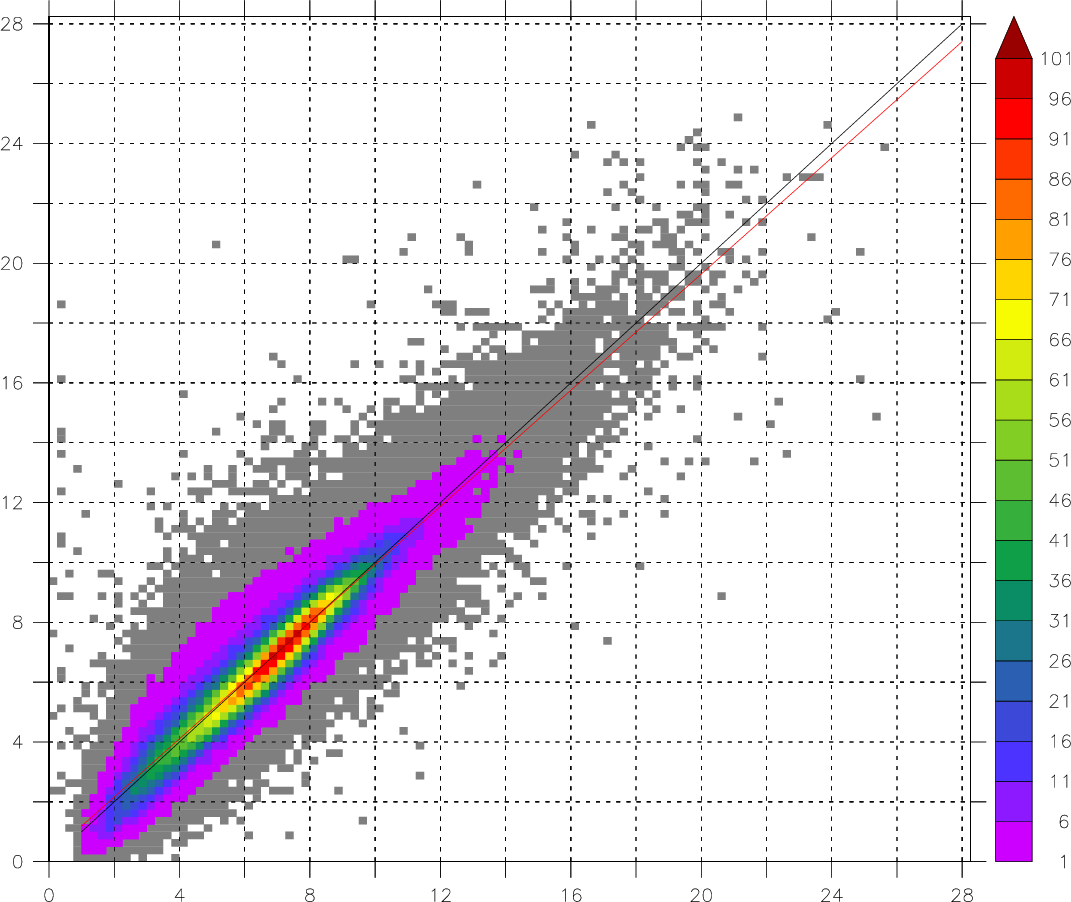
Inter-comparison results are shown here. The results of comparisons with in-situ buoy observations by Quality Checking System (QCS) are shown for each target dataset. The comparison results for mean fields are shown as bias bar-charts. The comparison results for variability are shown as Taylor diagrams.

MEAN FILELD: BIAS

The inter-comparison results for mean fields of LHF and SHF are shown as bias bar-charts.
The bias values were calculated by comparison with in-situ buoy observations in the global ocean.


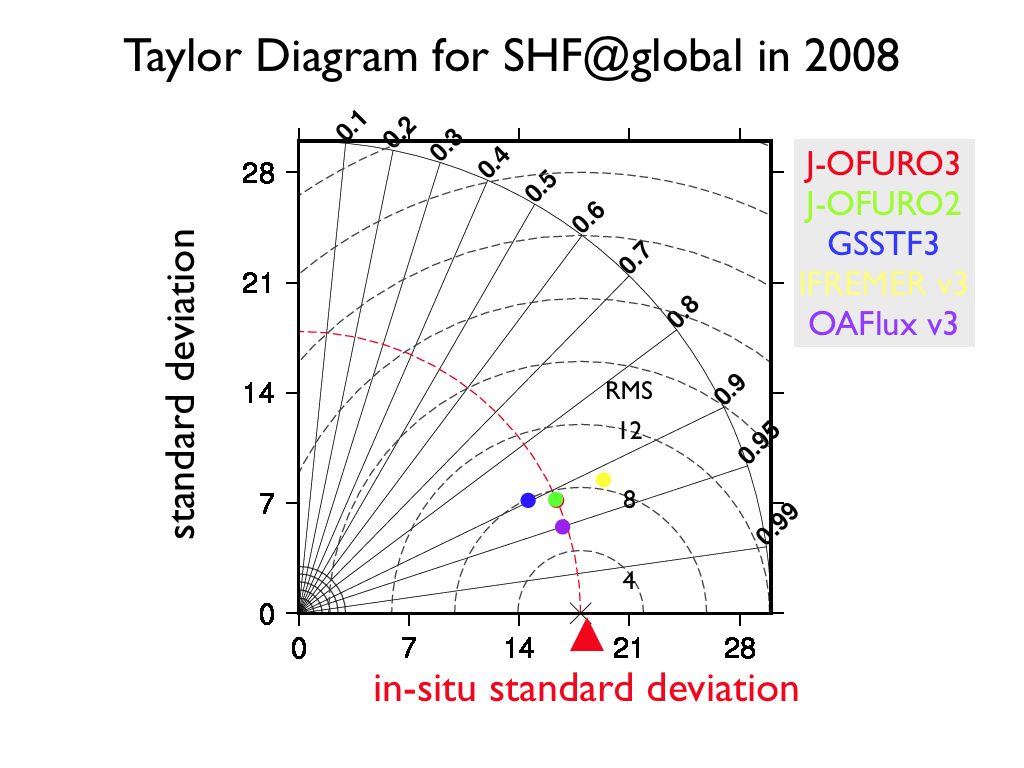
VARIABILITY: Taylor Diagram

The comparison results for variability of LHF and SHF are shown as following Taylor Diagrams.

X and Y axes of the Taylor diagram show standard deviation. The standard deviation for in situ buoy observation is shown as a red dot line. The contour lines with a center of the mark "X" (and a red triangle) on the X-axis show RMS errors. Angle from x-axis shows correlation coefficients between buoy and each product.

Units of standard deviation and RMS error are W/m^2.

The five circles are plotted on a Taylor diagrams based on statistics obtained by the comparison between in situ buoy observation and each five product.

Colors of circles and products:
Red: J-OFURO3 V1.0
Green: J-OFURO2
Blue: GSSTF3
Yellow: IFREMER v3
Purple: OAFlux v3

LHF


SHF


OVERVIEW

Validity of J-OFURO3 V1.0 turbulent heat fluxes (LHF and SHF) data was confirmed by the Quality Checking System (QCS) that was developed together with J-OFURO3. The target is J-OFURO3 V1.0 which consists of daily mean and 0.25 degree grid data from 2002 to 2013 (12 years). For the validation, the QCS contains in situ daily mean data for approximately 300,000 days in this period. These daily in situ database were collected by surface moored buoys in various ocean regions. As a results of validation using QCS, it was confirmed that mean and variability of LHF are quite similar to them of in situ observation. The bias is less than 1 W/m2 and standard deviation is almost same with in situ observation. For SHF, similar characteristics were found, but J-OFURO3 tends to underestimate SHF, approximately 2.5 W/m2, and shows slightly smaller standard deviation. RMS error, which shows random error, for LHF and SHF were about 29.1 and 8.7 W/m2, respectively. These values are corresponding to 48% and 47% of standard deviations for LHF and SHF, respectively. There are characteristic spatial patterns in LHF and SHF and the error features are related to the spatial patterns. LHF shows larger heat release from ocean in the mid-latitude regions and its variability is also large there. SHF shows larger heat release from the ocean in the mid-latitude and high-latitude regions. J-OFURO3 LHF and SHF tends to have larger random error in the such regions.

INTRODUCTION

In order to confirm validity of J-OFURO3 data set, we conducted the validation by comparing with in situ observation before a public release of the data set. To do this, we are using “Quality Checking System (QCS)” that was developed together with J-OFURO3. The QCS contains a large number of in situ observation data collected by surface moored buoys located in the various world oceans, and calculates a daily mean value of turbulent fluxes and related physical parametersusing high temporal resolution data with time interval of one hour (or lesser). The system uses the in situ daily mean data as a benchmark. Here, we briefly summarize the results of validation of turbulent heat fluxes and related physical parameters in J-OFURO3.

The target is J-OFURO3 V1.0 which consists of daily mean and 0.25 degree grid data from 2002 to 2013 (12 years)

COMPARISON STATISTICS

The following table shows comparison statistics between J-OFURO3 and buoy data for whole period.
For the definition of variable names and its units of J-OFURO3 data set, please see this table.

AVE_B: average (buoy)
AVE_G: average (J-OFURO3)
STD_B: standard deviation (buoy)
STD_G: standard deviation (J-OFURO3)
BIAS: mean difference (J-OFURO3 minus buoy)
RMS: root mean square difference
CORR: correlation coefficient
NUM: number of comparison data

*Statistics have the same units as its variable except for CORR and NUM.

VARLHFSHFQAQSTA10SSTWND
AVE_B114.8149.79416.04921.4825.04826.0966.529
AVE_G115.1447.26716.26421.4125.34526.0216.561
STD_B60.06118.4543.9694.9015.5635.3022.389
STD_G60.13119.7754.0174.8255.4195.2512.478
BIAS0.33-2.5270.215-0.070.297-0.0750.032
RMS29.1398.7151.1050.4330.9790.3490.873
CORR0.8820.8980.9620.9960.9840.9980.936
NUM296492296492296492296492296492299360299358

SCATTER DIAGRAM

Comparison results by the scatter diagrams.

X-axis: BUOY
Y-axis: J-OFURO3
Color: density of data number (%) (100% means the maximum data number shown in the caption.) Gray color means less than 1%.


LHF (MAX=4529)


SHF (MAX=38856)


QA (MAX=1892)

QS (MAX=4244)

TA10 (MAX=11683)


SST (MAX=22905)


WND (MAX=2018)


LATITUDE DISTRIBUTION OF STATISTICS


More detailed comparison results are shown as the following figures showing latitude distribution for LHF and SHF.


X-axis: latitude (-30degree – 60degree)
Y-axis: From the upper panel, buoy average, bias, RMS error, and correlation coefficients.


LHF


LHF, Latitude distribution of statistics


SHF


SHF, Latitude distribution of statistics