V1.0: Summary of validation
OVERVIEW
Validity of J-OFURO3 V1.0 turbulent heat fluxes (LHF and SHF) data was confirmed by the Quality Checking System (QCS) that was developed together with J-OFURO3. The target is J-OFURO3 V1.0 which consists of daily mean and 0.25 degree grid data from 2002 to 2013 (12 years). For the validation, the QCS contains in situ daily mean data for approximately 300,000 days in this period. These daily in situ database were collected by surface moored buoys in various ocean regions. As a results of validation using QCS, it was confirmed that mean and variability of LHF are quite similar to them of in situ observation. The bias is less than 1 W/m2 and standard deviation is almost same with in situ observation. For SHF, similar characteristics were found, but J-OFURO3 tends to underestimate SHF, approximately 2.5 W/m2, and shows slightly smaller standard deviation. RMS error, which shows random error, for LHF and SHF were about 29.1 and 8.7 W/m2, respectively. These values are corresponding to 48% and 47% of standard deviations for LHF and SHF, respectively. There are characteristic spatial patterns in LHF and SHF and the error features are related to the spatial patterns. LHF shows larger heat release from ocean in the mid-latitude regions and its variability is also large there. SHF shows larger heat release from the ocean in the mid-latitude and high-latitude regions. J-OFURO3 LHF and SHF tends to have larger random error in the such regions.
INTRODUCTION
In order to confirm validity of J-OFURO3 data set, we conducted the validation by comparing with in situ observation before a public release of the data set. To do this, we are using “Quality Checking System (QCS)” that was developed together with J-OFURO3. The QCS contains a large number of in situ observation data collected by surface moored buoys located in the various world oceans, and calculates a daily mean value of turbulent fluxes and related physical parametersusing high temporal resolution data with time interval of one hour (or lesser). The system uses the in situ daily mean data as a benchmark. Here, we briefly summarize the results of validation of turbulent heat fluxes and related physical parameters in J-OFURO3.
The target is J-OFURO3 V1.0 which consists of daily mean and 0.25 degree grid data from 2002 to 2013 (12 years)
COMPARISON STATISTICS
The following table shows comparison statistics between J-OFURO3 and buoy data for whole period.
For the definition of variable names and its units of J-OFURO3 data set, please see this table.
AVE_B: average (buoy)
AVE_G: average (J-OFURO3)
STD_B: standard deviation (buoy)
STD_G: standard deviation (J-OFURO3)
BIAS: mean difference (J-OFURO3 minus buoy)
RMS: root mean square difference
CORR: correlation coefficient
NUM: number of comparison data
*Statistics have the same units as its variable except for CORR and NUM.
| VAR | LHF | SHF | QA | QS | TA10 | SST | WND |
|---|---|---|---|---|---|---|---|
| AVE_B | 114.814 | 9.794 | 16.049 | 21.48 | 25.048 | 26.096 | 6.529 |
| AVE_G | 115.144 | 7.267 | 16.264 | 21.41 | 25.345 | 26.021 | 6.561 |
| STD_B | 60.061 | 18.454 | 3.969 | 4.901 | 5.563 | 5.302 | 2.389 |
| STD_G | 60.131 | 19.775 | 4.017 | 4.825 | 5.419 | 5.251 | 2.478 |
| BIAS | 0.33 | -2.527 | 0.215 | -0.07 | 0.297 | -0.075 | 0.032 |
| RMS | 29.139 | 8.715 | 1.105 | 0.433 | 0.979 | 0.349 | 0.873 |
| CORR | 0.882 | 0.898 | 0.962 | 0.996 | 0.984 | 0.998 | 0.936 |
| NUM | 296492 | 296492 | 296492 | 296492 | 296492 | 299360 | 299358 |
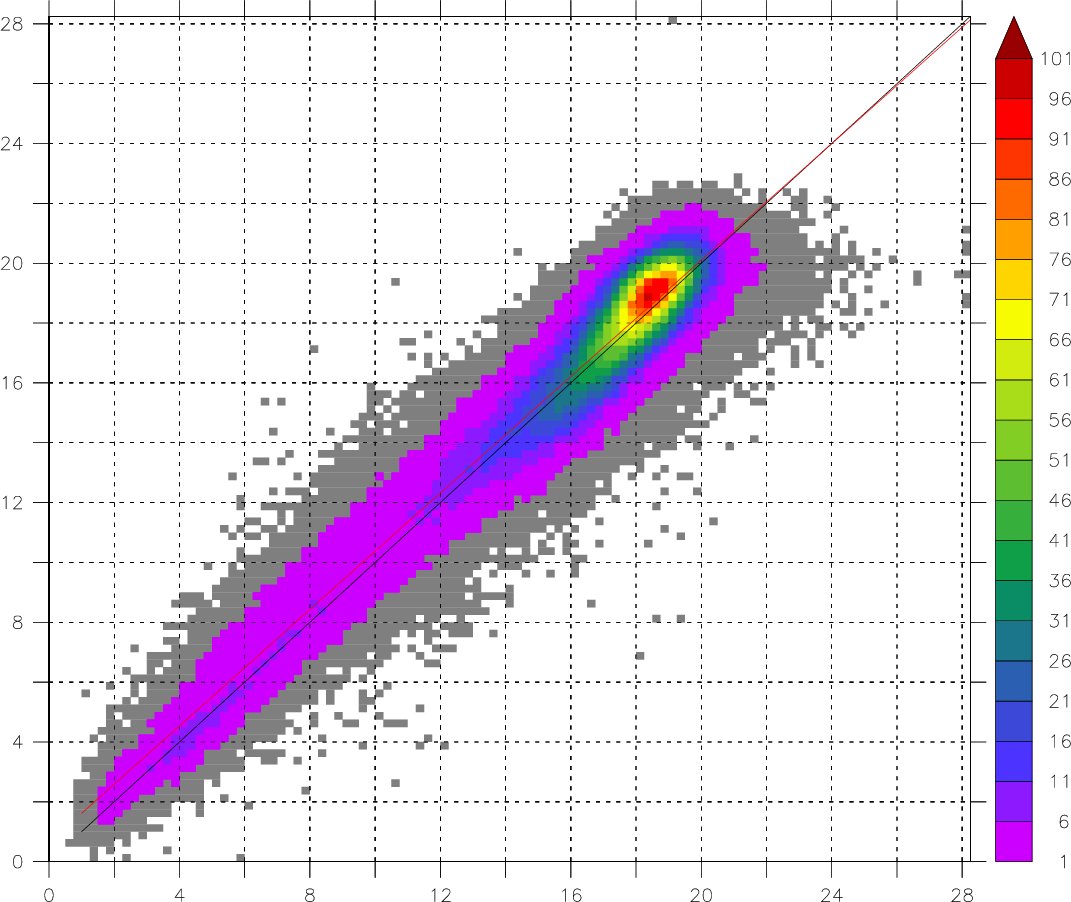
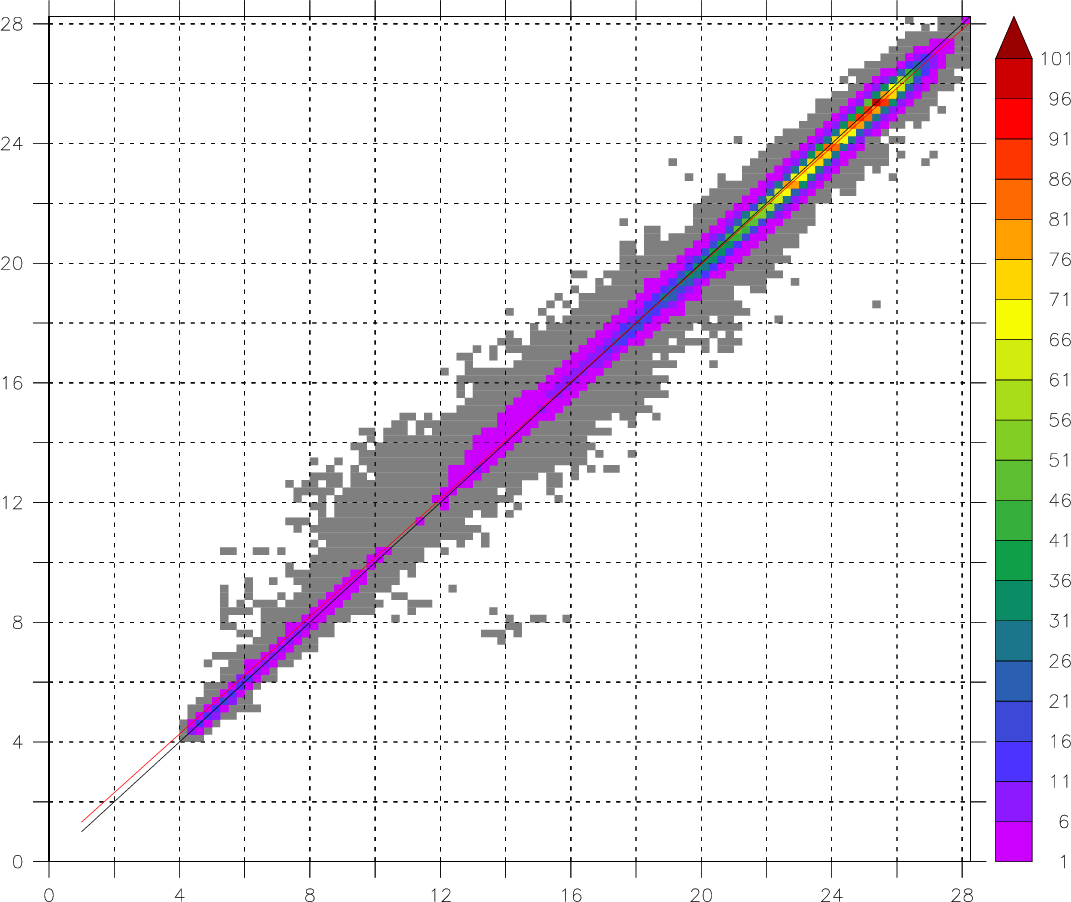
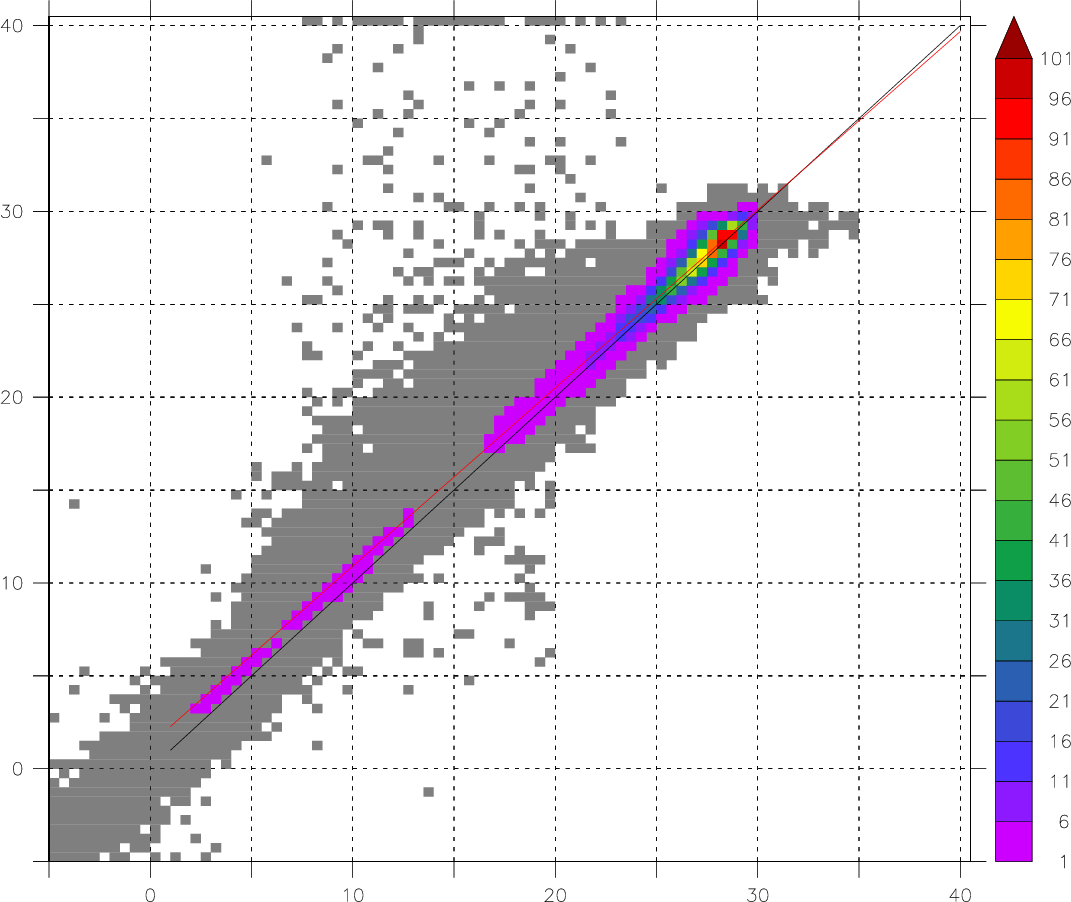
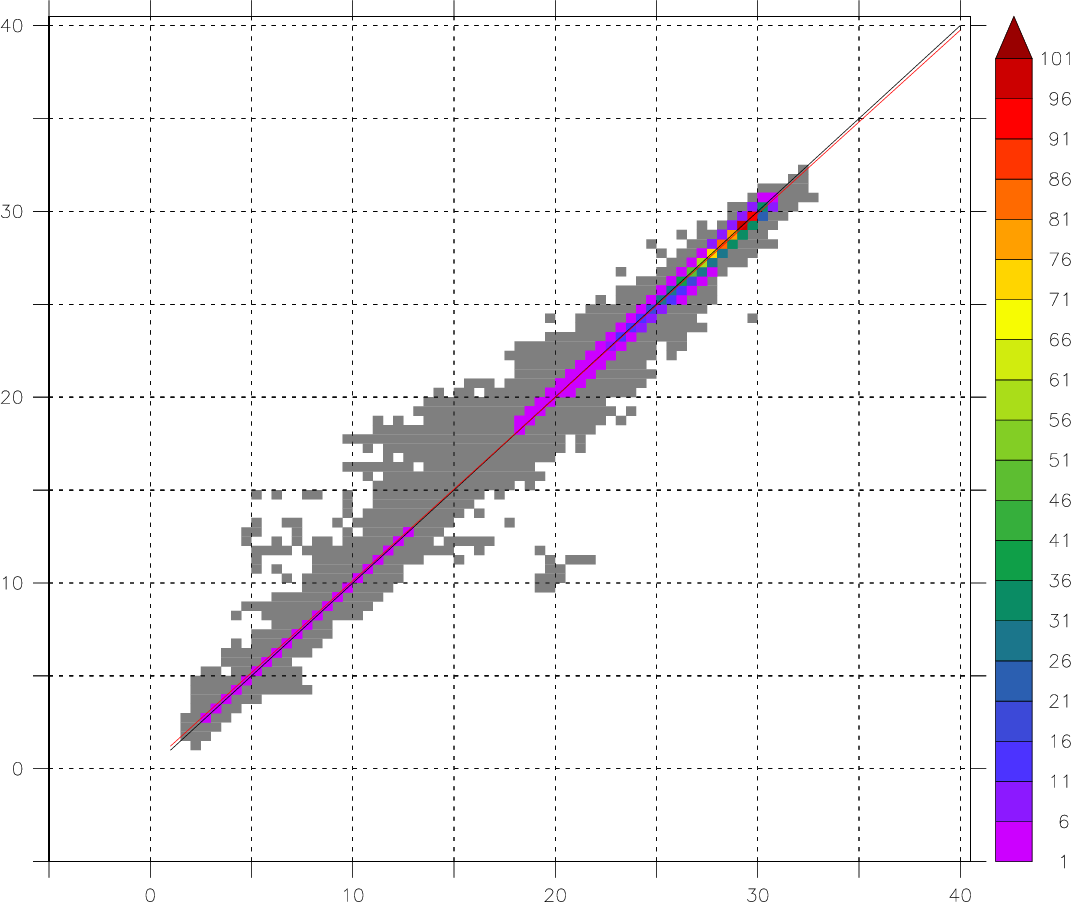
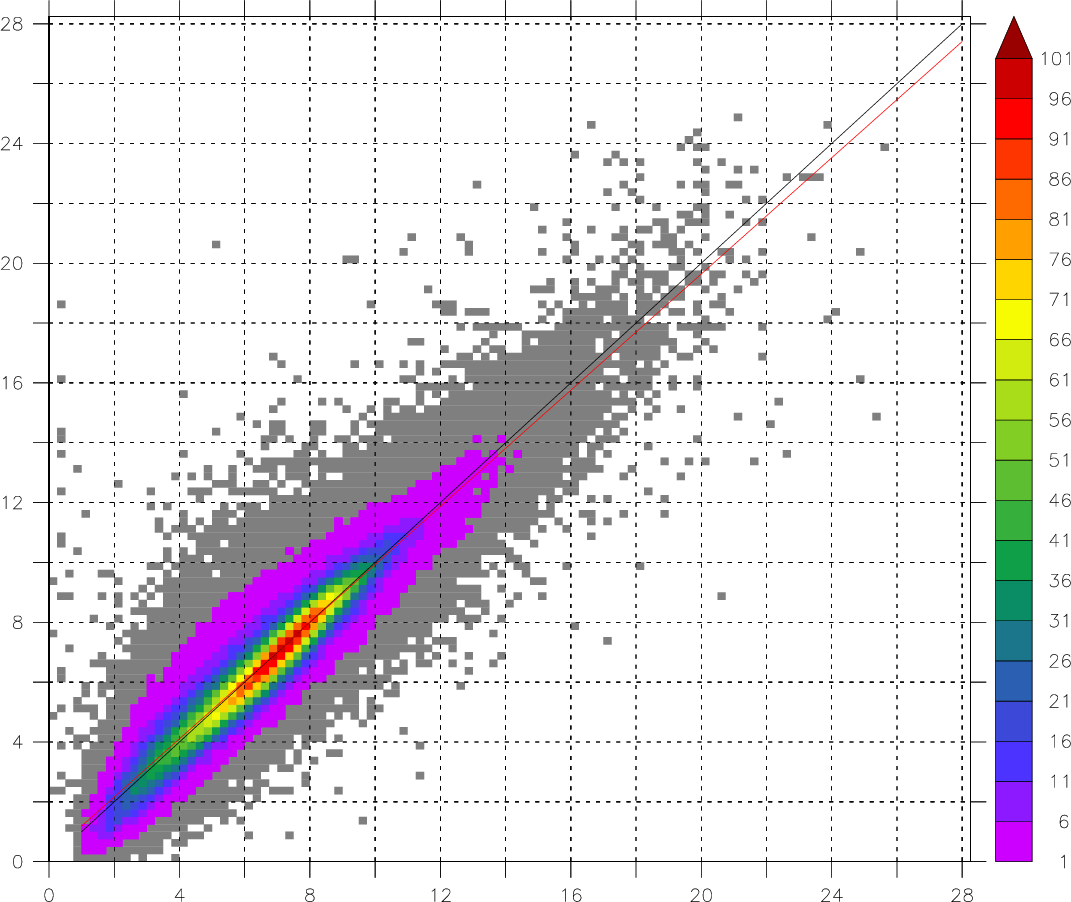
SCATTER DIAGRAM
Comparison results by the scatter diagrams.
X-axis: BUOY
Y-axis: J-OFURO3
Color: density of data number (%) (100% means the maximum data number shown in the caption.) Gray color means less than 1%.
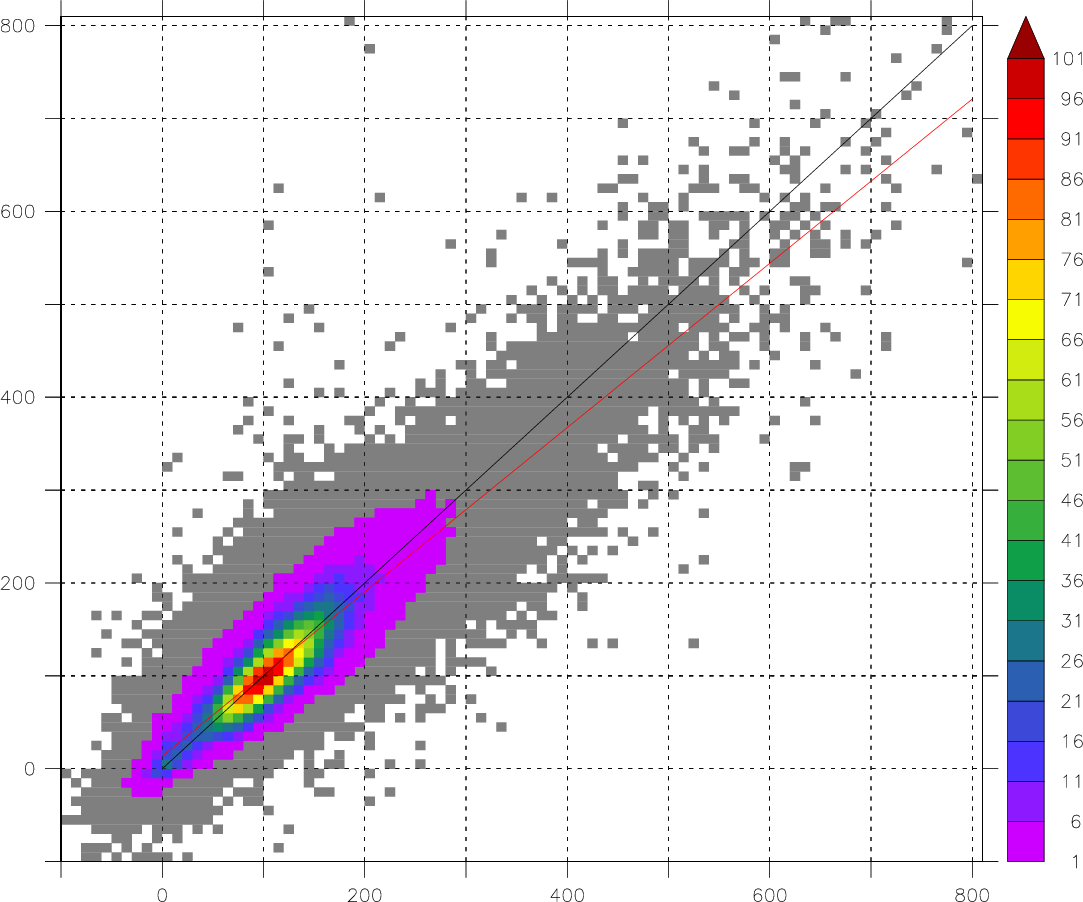
LHF (MAX=4529)
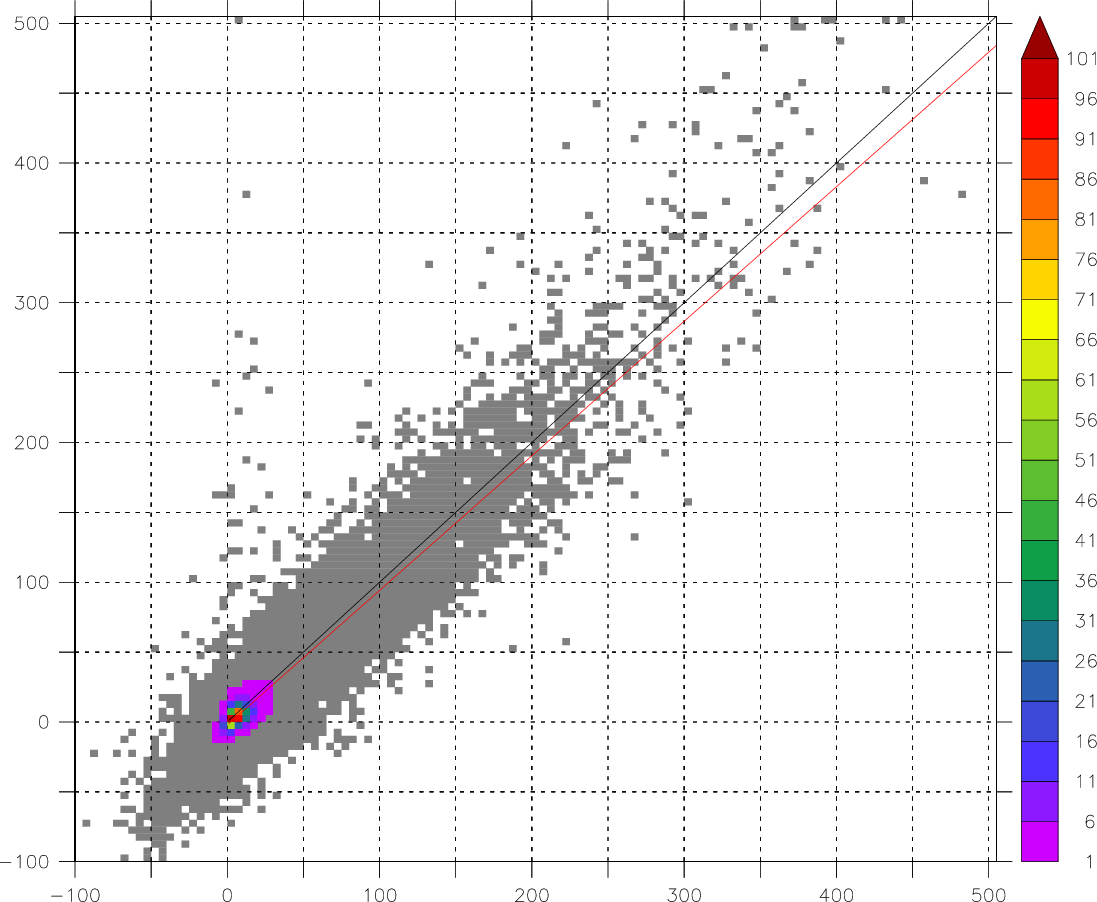
SHF (MAX=38856)
QA (MAX=1892)
QS (MAX=4244)
TA10 (MAX=11683)
SST (MAX=22905)
WND (MAX=2018)
LATITUDE DISTRIBUTION OF STATISTICS
More detailed comparison results are shown as the following figures showing latitude distribution for LHF and SHF.
X-axis: latitude (-30degree – 60degree)
Y-axis: From the upper panel, buoy average, bias, RMS error, and correlation coefficients.
LHF
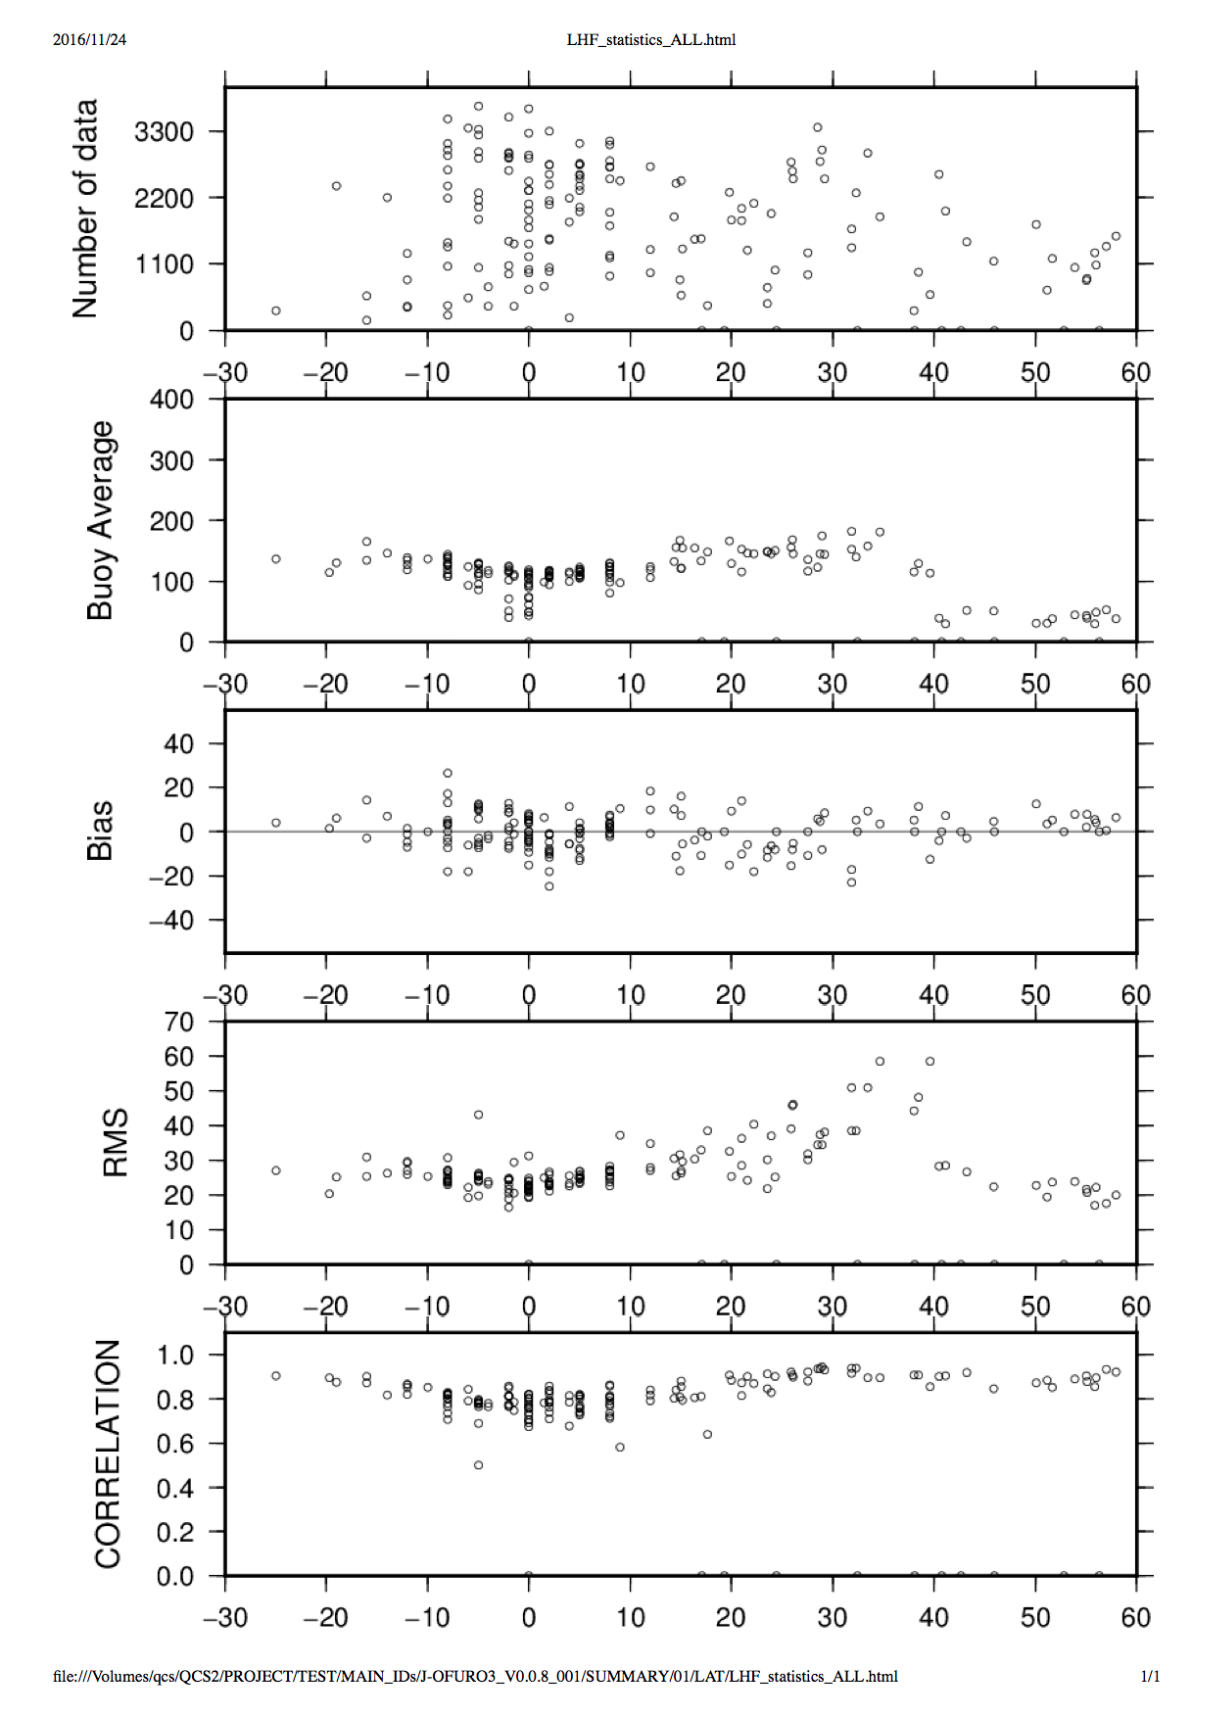
LHF, Latitude distribution of statistics
SHF
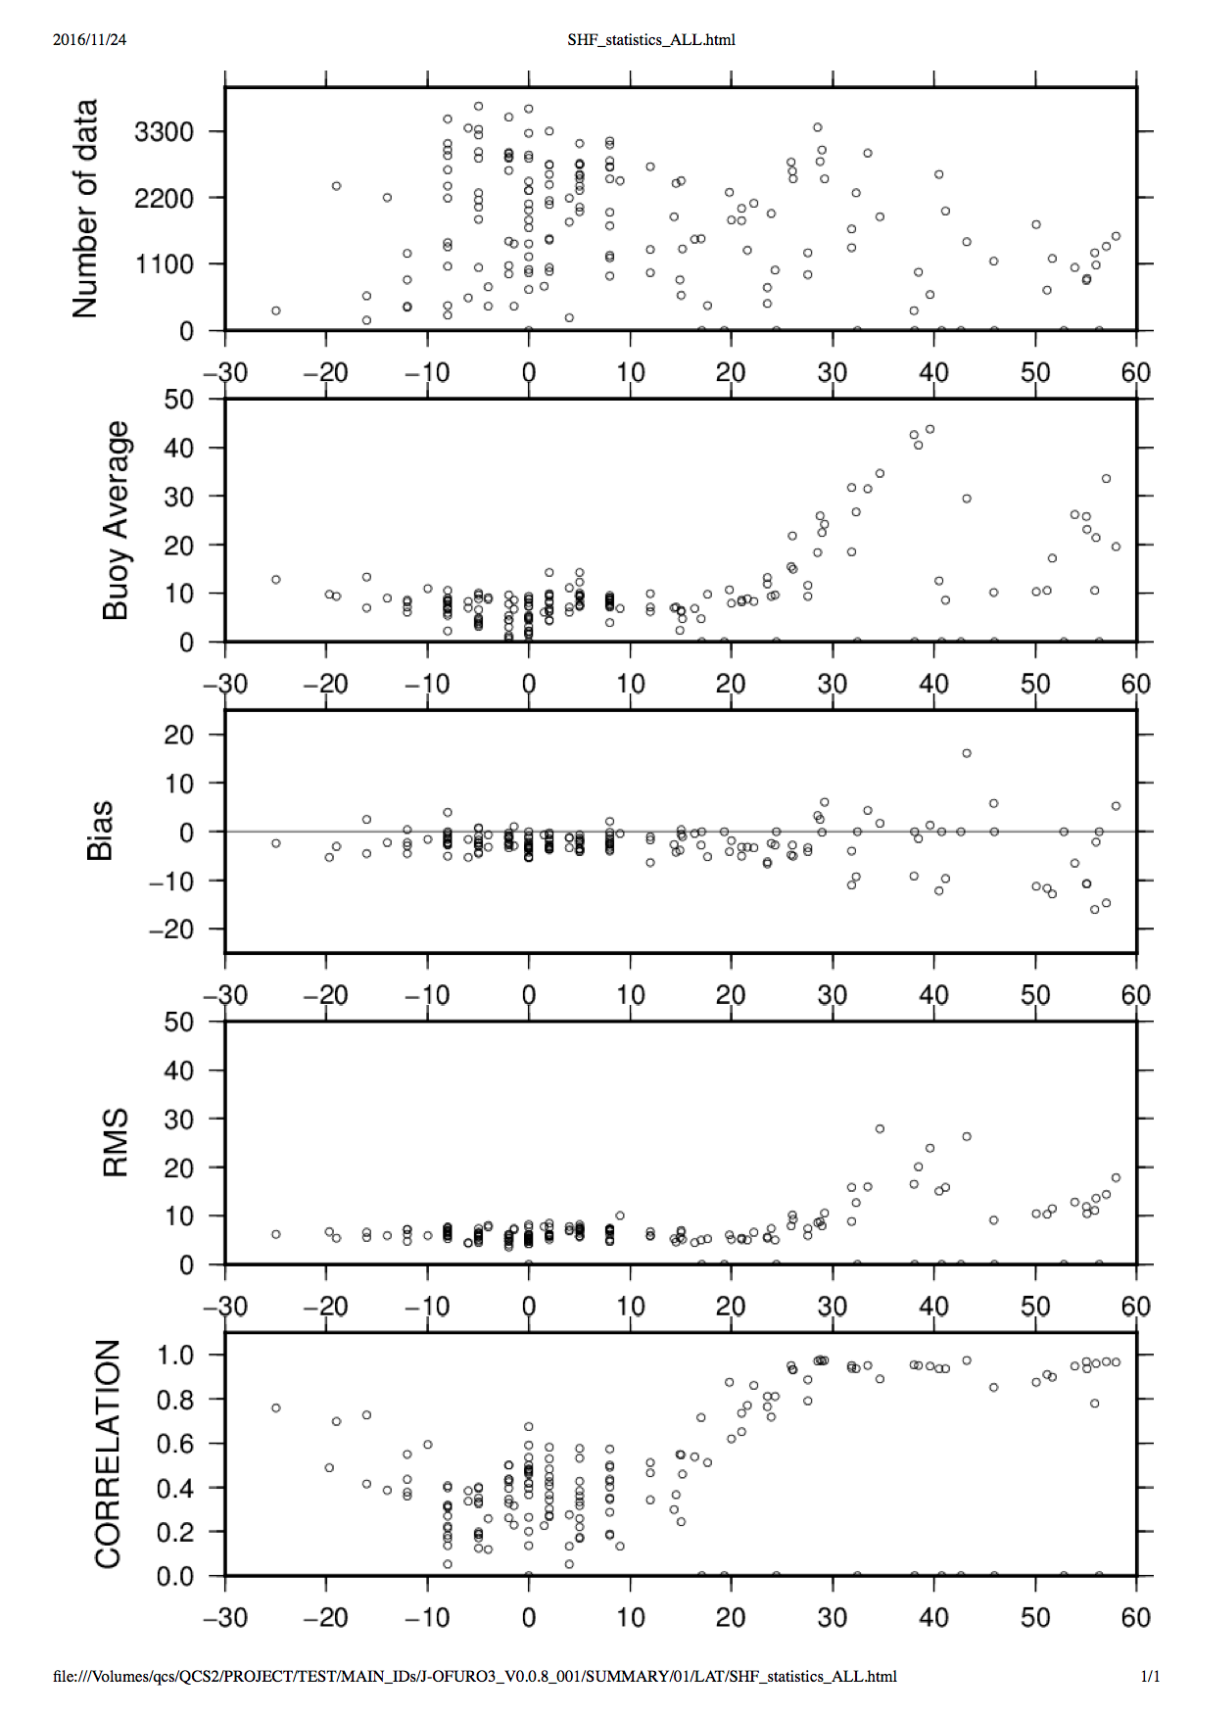
SHF, Latitude distribution of statistics